Over the three fiscal years between 2018-2021, Social Services saw an average of 245 clients per year. There was a dramatic decrease during the 2021-22 academic/fiscal year that Social Services attributed to a decrease in the unit’s staffing. Social Services was limited in the number of appointments it could offer due to staffing levels. In the 2022-23 fiscal year, the number of clients served for SVSH reasons increased slightly above 2021-22 (Figure 28).
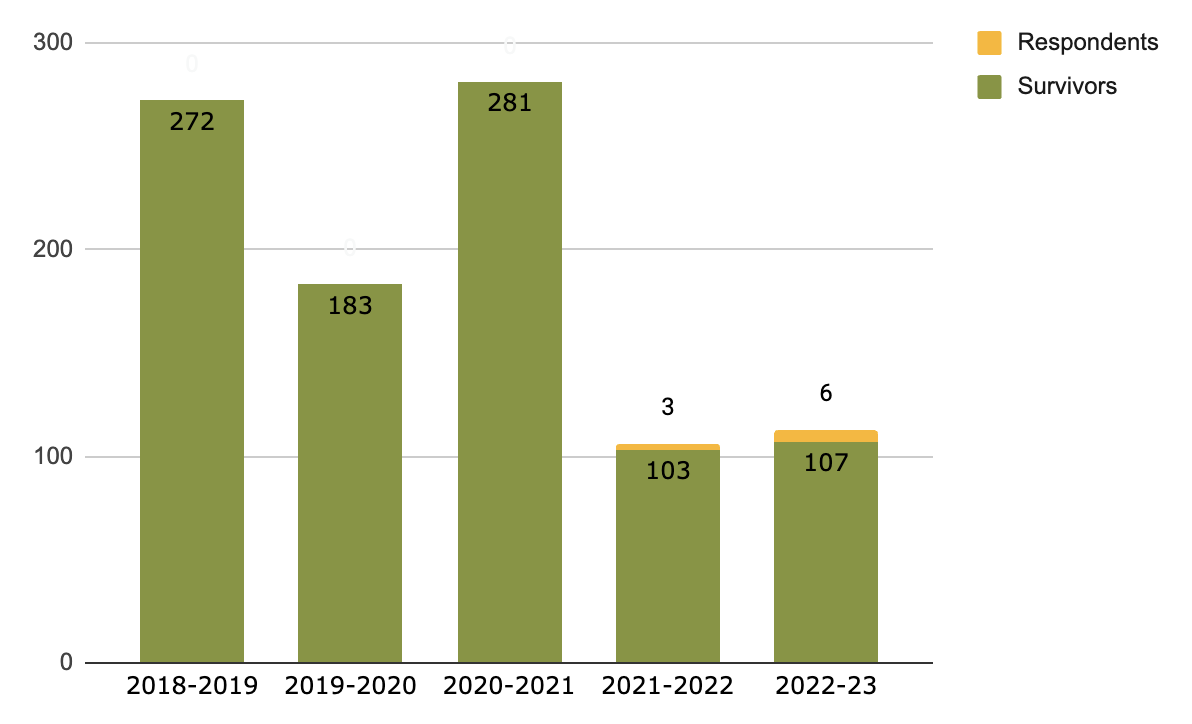
Figure 28: Trends in the number of clients served by Social Services for SVSH from 2018 to 2023 (in academic/fiscal years)
In the 2018, 2019, 2020, and 2021 SVSH Annual Reports, respondents were included in the total number of clients Social Services saw for reasons related to SVSH. Beginning with the 2021-22 academic/fiscal year, respondents are broken out from the total, but included in the same bar. The number of respondents that Social Services works with each year has not changed dramatically since 2018.